COMMUNICATION DESIGN / PRINT
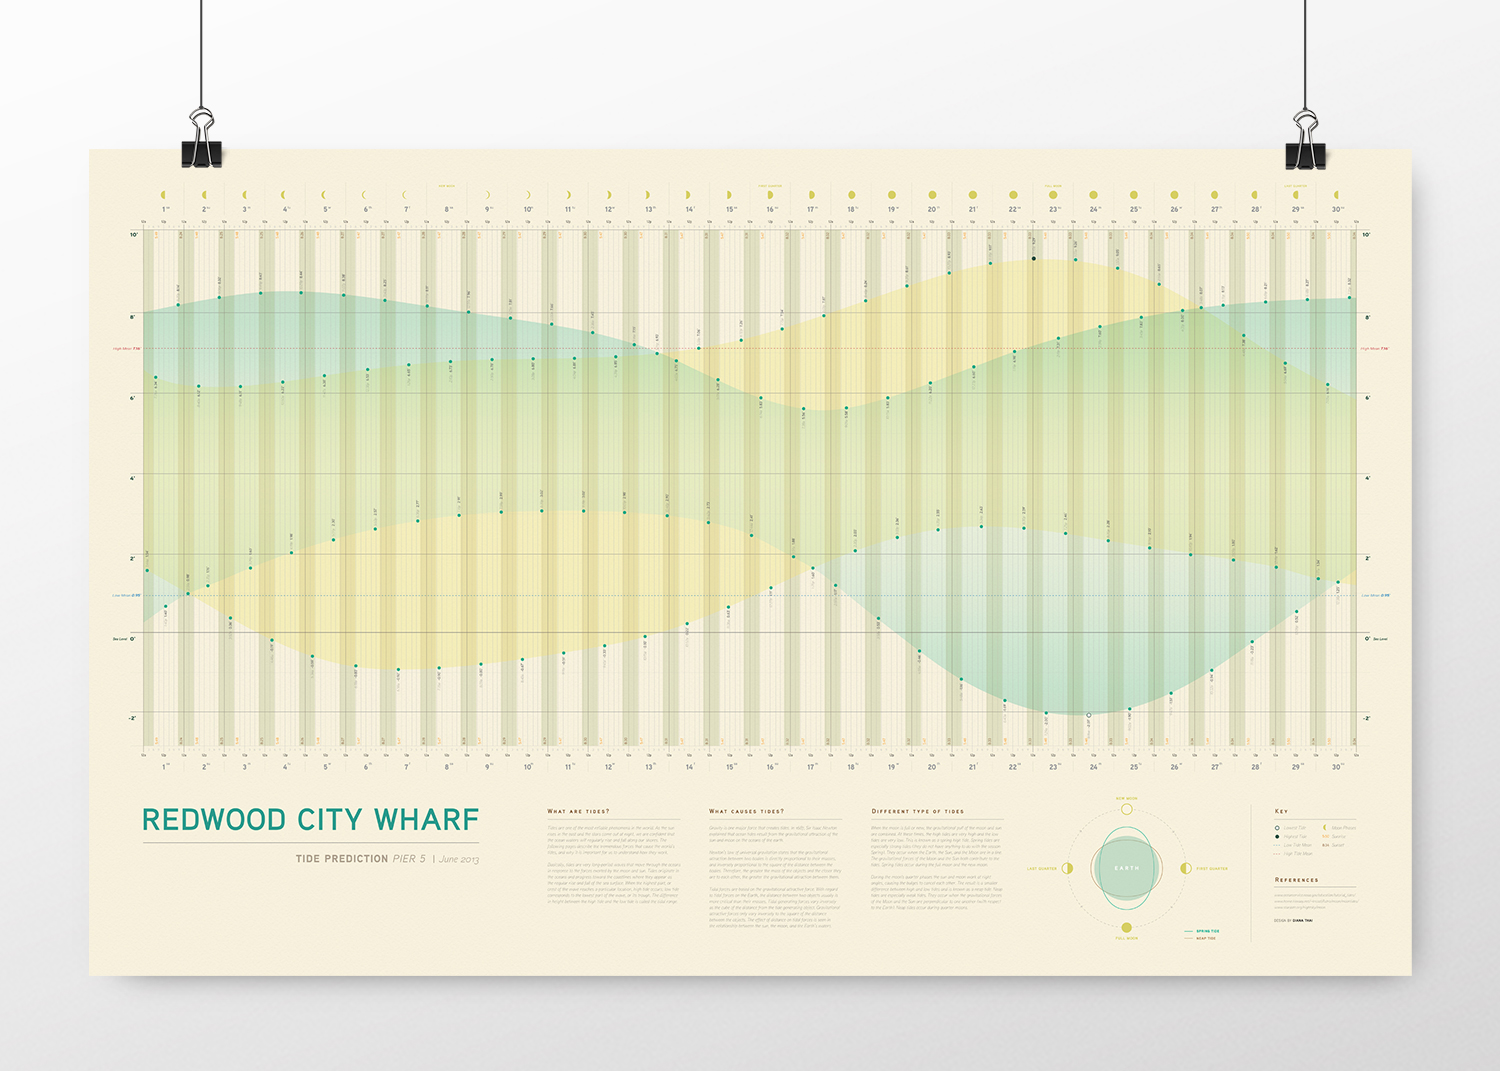
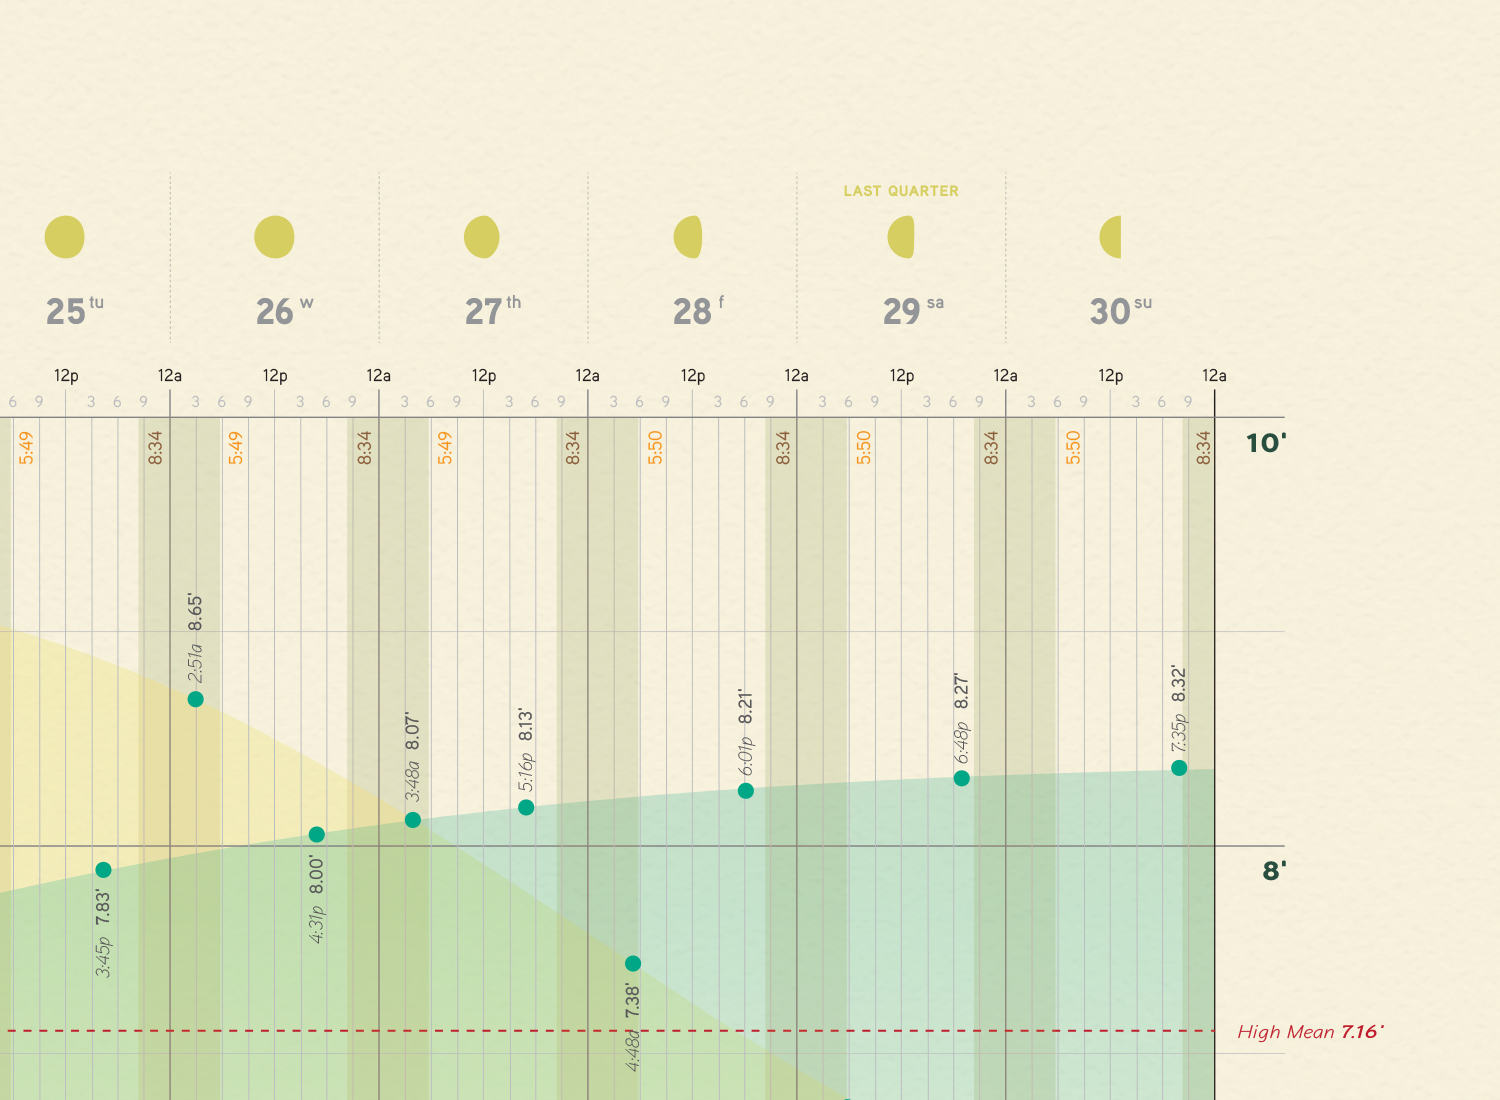
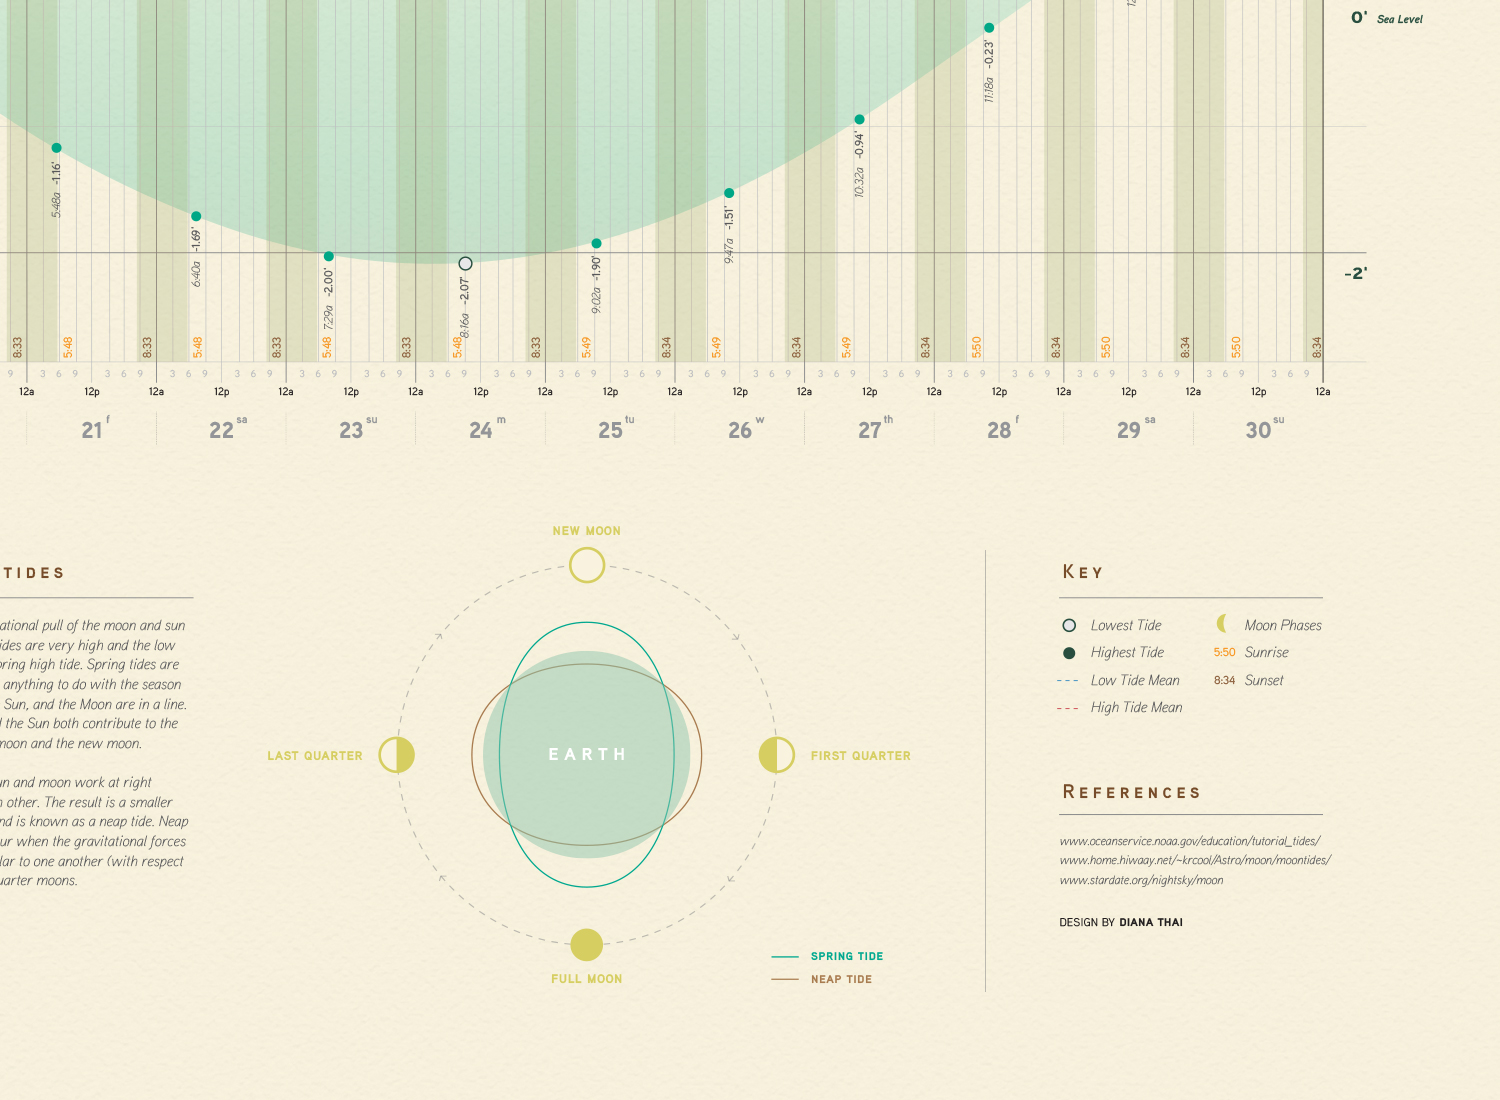
Tide Prediction Chart
Objective:
Diagram the Bay Area's Redwood City Wharf's tide prediction for the month of June 2013. The graph must include data for high and low tides, amount of daylight and darkness, sunrise and sunset, and the moon phases.
Tasks:
Organize the data to be easily accessible in both macro and micro views with clear hierarchy.